
Displaying data in a table
Tables are a great way to display your data when the actual numbers in your results are important. Visually, they are not as attractive as figures or graphs, and the trends in your data may not be as obvious to the reader. However, if the reader wants to know the exact values you are reporting or if they want to use the data themselves, a table can be really valuable.
Let’s look at some of the different circumstances where using a table would be appropriate.
Reporting values
One place where a table can be effective is to report the values that you used.
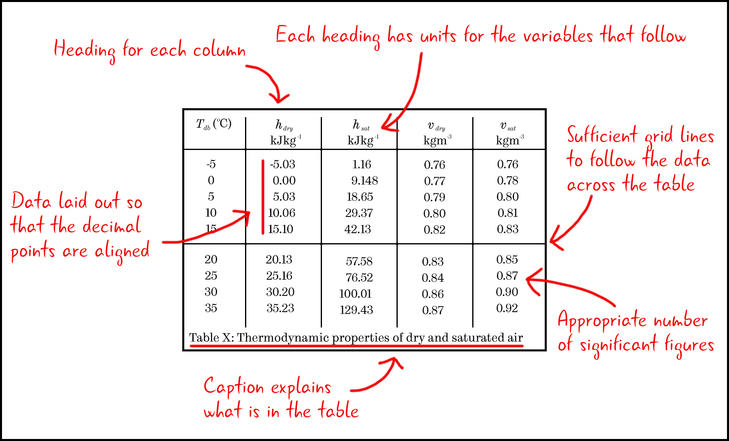
Table 1: An example of a table for displaying values used in an experiment.
This table demonstrates some best practice tips for presenting data in tables:
- There is a heading for each column.
- Each heading has the units for the variable that follows.
- There are sufficient grid lines to allow the reader to follow the data across the table, but not so many that each number is in its own box.
- The data is reported to an appropriate number of significant figures.
- Data is laid out so that the decimal points are aligned (this makes it easier for the reader to discern changes in the magnitude of values).
- A caption gives the reader information about what is in the table.
Setting up information
Another place where tables are useful is if you have a series of different cases or parameters. You should show these in your report so the reader knows what you did and will be able to reproduce the work if necessary.
For example, the names defined in the table below can be used throughout the report to refer to the cases. This will allow the reader to see the differences between the different computer simulations that were run. In this case, they were 2 and 3-dimensional models and different leak sizes and positions.
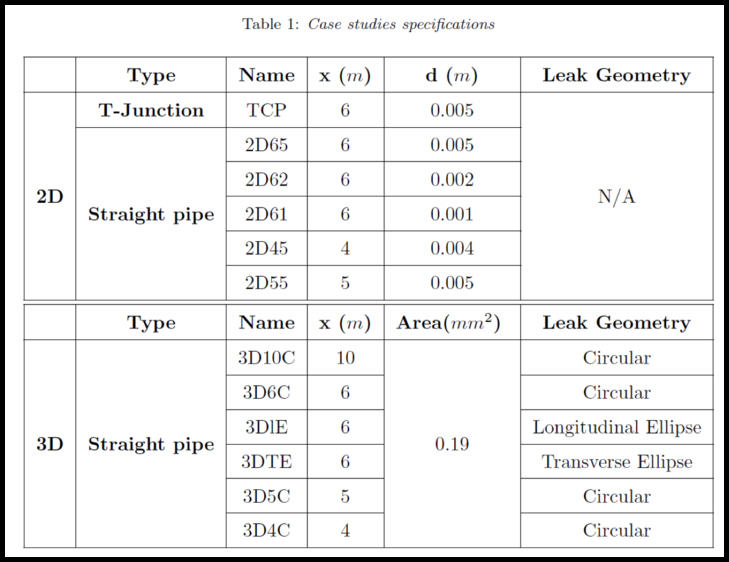
Table 2: An example of a table showing setup information.
Note that the table contains both numerical and non-numerical information. There are headers for the columns, which have the units in as required. Also, notice the careful use of grid lines to guide the user in what is unique and what is common between the models.
Reporting non-numerical data
Tables are also useful for conveying results that do not have a numerical value.
For example, in the table below the results of an experiment have been processed and a decision made as to whether the output was stable (Yes/No).
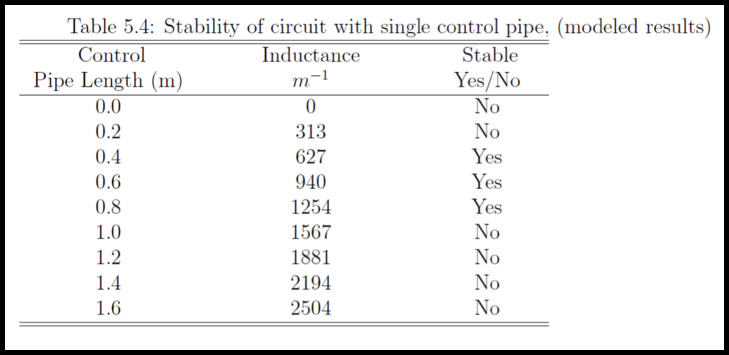
Table 3: Processed numerical results showing non-numerical output.
The table is an excellent way to display this. There are two ways of defining the input (pipe length and inductance) and the output is a description (stable/unstable).
Combining data
It is always useful to think about combining tables to save space. For example, the table above could have been two tables; one with length and inductance and the second with inductance and stability. By combining this data, there is no loss of information and the flow of the writing will not be impeded.
Table tips
When you come to make a table for your report, ask yourself the following questions to make sure you are displaying your data most effectively.
-
Is a table the best way to display the data?
Often a graph in the main body of a report and a table with the actual values in the appendix will be most effective. -
How do you want to set the table out?
Make sure the headings are clear and that units are included. -
Have you labelled your table?
Put a number and a title under the table so you can refer to it in the text. You can add “above” and “below” to the description, but this is not as useful as numbering tables. Some publications prefer the title to be above the table, so always check your house style. -
Do you have many unnecessary decimal places?
Report data to an appropriate number of significant figures and choose units so that your table does not include many zeros or unnecessary numbers.
For example, in the table below, the units chosen for distance and stress require multiple digits to correctly represent the values (such results can be reported by analysis software).
| Distance (m) | Stress (Pa) |
|---|---|
| 0.001 | 18541452 |
| 0.002 | 26756513 |
| 0.003 | 79629088 |
This table can be improved by choosing an appropriate unit for distance (mm instead of m) and by rounding the stress values to an appropriate number of decimal places (what this is will depend on your assessment of the errors in the values).
| Distance (mm) | Stress (MPa) |
|---|---|
| 1 | 18.5 |
| 2 | 26.8 |
| 3 | 79.6 |
Discussion
Do you think tables are an effective way of displaying data. Can you think of an example where you have used a table effectively in a report?