How would you improve this graph?
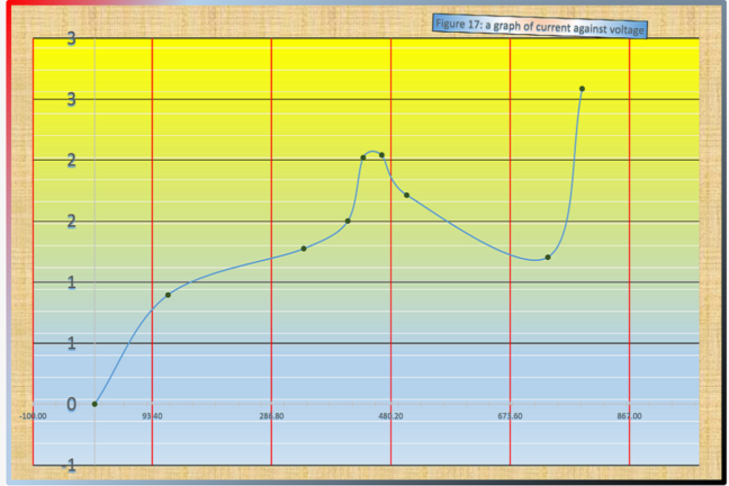
Take a look at the graph below. There are many, many, ways in which this graph can be improved. Can you identify what these are?

Take a look at the graph below. There are many, many, ways in which this graph can be improved. Can you identify what these are?
