Be the marker: Discussion section
So far this week, we have learned what goes in a Discussion and the type of language and tone you should use when writing one. In this discussion, we’d want to put this (and previous) knowledge to the test.
Below is an example Discussion section. We’d like you to read through this example and comment on the following:
- What is good about it?
- What is bad?
- How might the section be improved?
Discussion
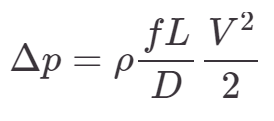
In this report, we are considering if the pipes that exist in our current distribution network should be repaired or replaced to reduce pumping cost. The relative roughness of a pipe is defined as the ratio of the pipe wall roughness and the pipe diameter. It becomes difficult to directly measure the roughness due to variation across the surface. In this experiment the relative roughness of the inside wall of a specimen pipe was determined through experimentation, by measuring the pressure drop for known flow rates of water. The relationship between pressure drop and average velocity of is given by:
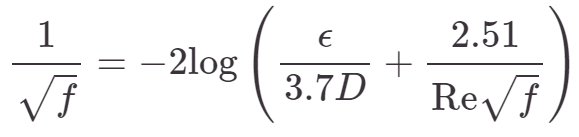
So, we can easily measure the geometrical properties of the pipe, the Length and the Diameter, and we know the density of water and the number 2. Therefore if the velocity and pressure drop can be measured on a sample of the pipe, the only remaining unknown in the equation is f, the friction factor. If we know the friction factor, and can use the velocity to determine the Reynolds number, we can determine the pipe relative roughness from the Colebrook equation [4]:
A sample of the pipe was set up with pressure tappings at a known distance apart. Water was then pumped through the pipe and the flow rate, which can be used to determine the average velocity, was recorded using a weigh tank. The results show that at a Reynolds number of 10,000 the friction factor was 0.05 and at 50,000 it was 0.045. This indicates that the inner surface of the pipe has a relative roughness of around 0.015.
There could have been an error in calibrating the weigh tank and pressure readings could have been subject to parallax error. As already stated, we think the errors in the experiment are =+/- 3.
The significance of the findings relate the the increased use of energy required to pump the water in the distribution network using this roughness of pipe. Reducing the relative roughness of the pipe walls to 10-4, the friction factor could be reduced to approximately 0.03. It is estimated that that would reduce pumping power by approximately 30kW, which a potential cost saving of £26,280 per year. The estimated costs of repair and replacement of pipes to reduce the friction factor is 136,000, including downtime and installation. With a rigorous consideration of the uncertainties in the analysis, the payback period for the investment is between 4.5 and 5.8 years. It is therefore recommended that the current pipework remains in service.