Be the marker: Procedure section
This week, you have learned what is good practice for putting together a Procedure section. In this discussion, we’d want to put this knowledge to the test.
Below is an example procedure section. We’d like you to read through this example and comment on the following:
- What is good about it?
- What is bad?
- How might the section be improved?
3. Procedure
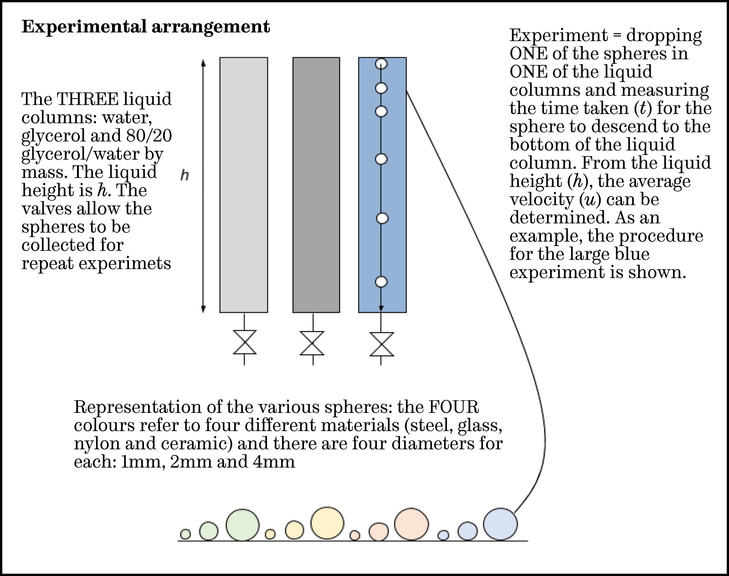
Diagram

Experimental procedure
A single experiment consists of calculating the average velocity of a particular sphere in a particular liquid. A sphere is dropped onto the upper surface of the liquid and, due to gravity, it settles to the bottom. There were two fixed points on the columns. Care was taken to avoid spills and to ensure the ball was placed at the centre of the column to minimise wall effects. The distance between these points will be determined after the experiment is completed. We used a stopwatch (precise to 0.01 seconds) to time how long it takes for the ball to travel between these two points. By dividing the distance travelled by the time taken to travel the average velocity of the ball can be determined.
The first set of experiments involves the water column and a selection of the spheres. The second set of experiments involves the glycerol column and just the smallest spheres. For those experiments with fast transit times, repeat experiments were carried out. The detailed procedure (actual number and order of experiments) is listed in the Results section.
Experimental procedure
As shown above, there are three columns, each with a diameter of 10 cm. One column is filled with water, one with glycerol and the third is filled with a mixture of water and glycerol. There is a range of both sphere size and sphere material available for the experiment. There is a trap at the base of each column that allows the spheres to be removed conveniently without significant loss of liquid.