Around the figure
So you’ve just spent hours creating the perfect figure to include in your report. To make sure it gets the impact it deserves, you need to make sure it’s labelled and referenced properly.
When adding a figure, there are three simple things you need to check:
- Every figure is numbered consistently.
- The figure is referred to in the text (preferably before the figure is shown).
- The figure has a caption that describes what it is.
1. Every figure is numbered consistently.
Let’s start with numbering. In short reports this should be Figure 1, Figure 2 etc. in longer reports you may want to include the chapter number i.e Figure 1.1, Figure 1.2. Whichever style, it’s important to ensure there is a unique identifier for each figure which you can then refer to in the text i.e. “as shown in Figure 1.2”.
2. The figure is referred to in the text.
Figures should generally go after they have been referred to in the report, and as close to this as possible. Having to flick onwards or backwards to look at figures can be disruptive to the reader so try to keep that to a minimum.
Every figure should be included for a reason. A common mistake when writing a report is to include figures that you consider interesting, but are not discussed in the text. A useful check to perform when you have written a report is to ensure that all the figures included are referenced in the text at some point. Using figure numbers helps with this process.
Figures are meant to help the reader to understand the project and its significance. With this in mind, it’s important that the reference to a figure is not just “shown in Figure 1.2””. Depending on what the figure is, the text must draw the reader to the important points.
Do not expect the reader to interpret figures, instead, you should give a clear explanation which is supported by the figure. Try and make sure the reader knows exactly what they are looking at, this is particularly important when using figures to show results (which we will cover in more detail next week).
3. The figure has a caption that describes what it is.
Captions should be simple but informative. It is important to strike the balance between a clear title for the figure and the supporting discussion which is within the text.
Let’s look at some example captions for the following figure.
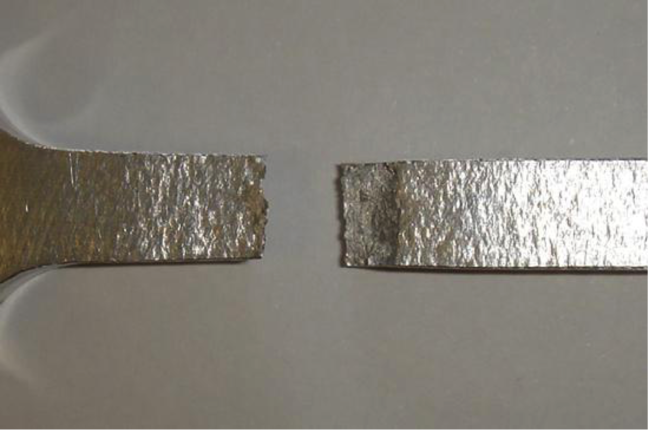
Figure 1. A broken specimen.
This caption tells us pretty much nothing. This is an example of a poor caption.
Figure 1. The fracture surface of an aluminium sample after tensile loading.
This tells us which specimen it is (aluminium) and also what we are looking at (fracture surface). This is a much better caption.
Figure 1. Fractured sample made from an aluminium alloy (AA2024-T351) subjected to quasi-static tensile loading. Fracture occurs after localised necking in the gauge section of the sample.
This caption also tells us about the circumstances of the fracture. If you were going to put several specimen pictures in together, then giving the stress at fracture within the caption could aid the reader’s comparison between the samples.
How much information to include in the caption is up to you as the writer. What is important is that there is enough information so that if the reader only looked at the figures, they would still understand what they are looking at.